Mega Store Sales Report

(Dashboard Creation | Sales Forecasting | Insights)

Objective: To contribute to the success of a business by utilizing data analysis techniques, specifically focusing on time series analysis, to provide valuable insights and accurate sales analysis.

Project highlights:
     I. Created interactive dashboard to track and analyze sales data
     II. Used complex parameters to drill down in worksheet and customization using filters and slicers on time series dataset
     III. Created connections, join new tables, calculations to manipulate data and enable user driven parameters for visualizations
     IV. Used different types of customized visualization

Visuals built:
     I. Filters based on the “Region” of sales
     II. Comparison and highlight
         o Monthly sales on Year-on-Year basis (2019 & 2020)
         o Monthly profits on Year-on-Year basis (2019 & 2020)
    III. Visualize:
         o Sales by Categories
         o Sales by Shipping Modes
         o Sales by States
         o Sales by Sub-categories
     IV. KPIs for Business
         o Orders
         o Sales
         o Profit
         o Shipment Days
    V. Sales Forecasting (next 15 days)
        o Sales by Order Date
The Report contains:
     I. Different KPIs
     II. Bar Chart
     III. Line Chart
     IV. Slicers Tiles
     V. Doughnut Chart
     VI. Sales Forecasting with Visual Zooming Sliders
     VII. Interactive Map

(Plesae sign in to your Power BI account to access the interactive embedded dashboard.
If you don't possess an account, the snapshot below provides a decent representation of the dashboard and the sales forecasting.)

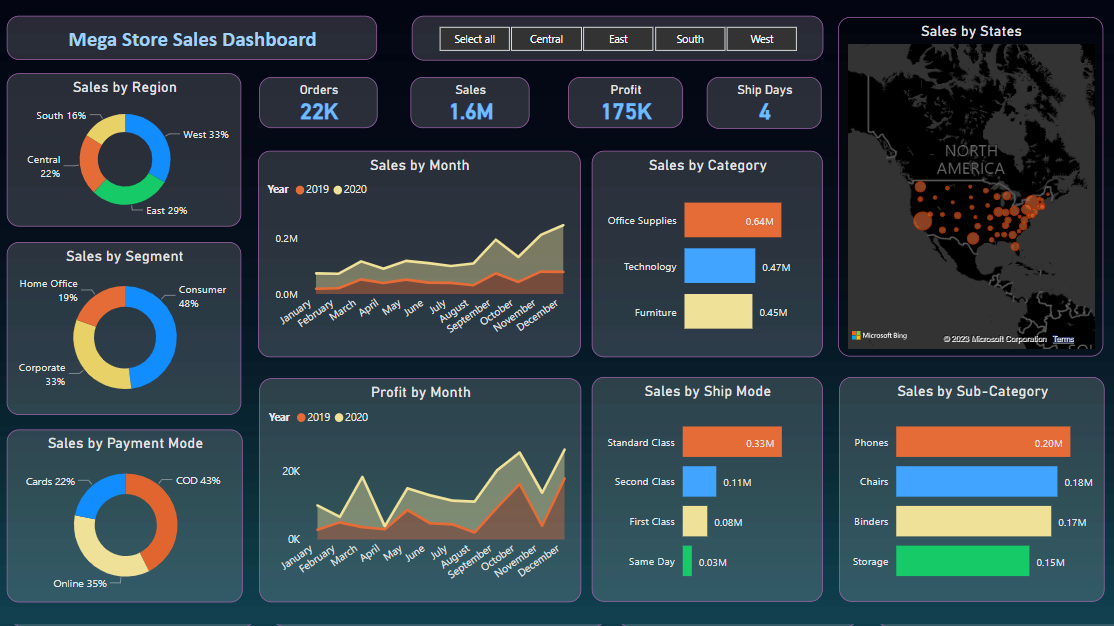
Mega Store Sales Dashboard (Snapshot)

Sales dashboard 1

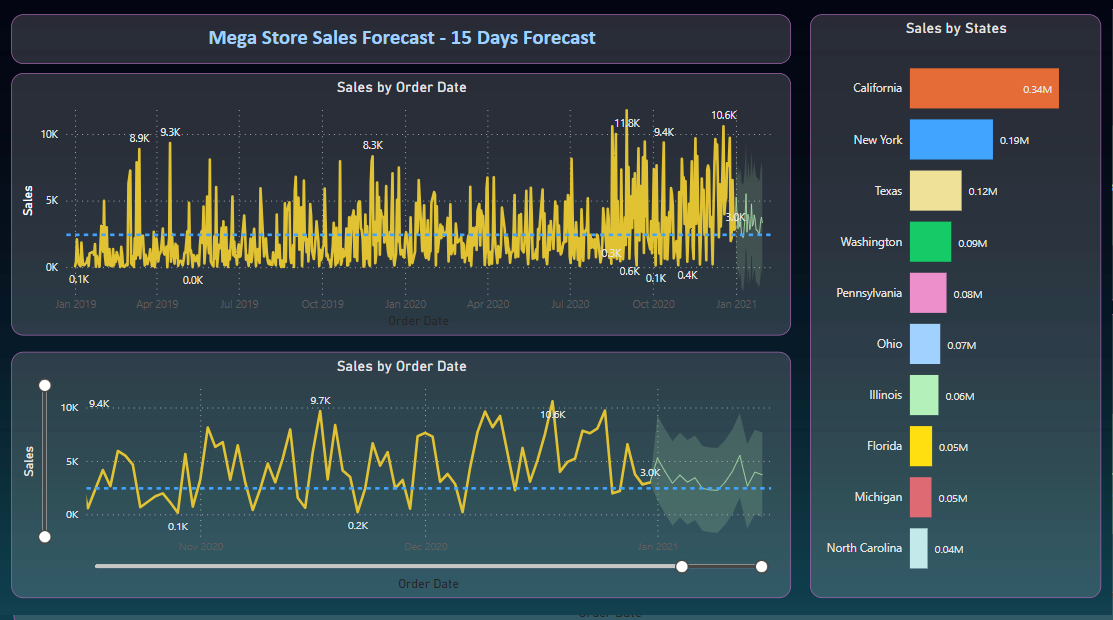
The forecasting section includes a visual zooming slider for a prediction with 95% confidence interval.

Sales dashboard 2

Insights:
o In 2 years, there were 22K orders placed, with 1.6M sales and 175K profit. The average delivery time was 4 days.
o The highest sales occurred in December.
o The highest profit was achieved in October and December.
o The Western region led in sales with California being the top-performing state across the entire US.
o Conversely, the Southern region reported the lowest sales share.
o Among the sales categories, office supplies stood out, and the preferred shipping mode was Standard Class. Notably, in the Technology category, Phones emerged as the top-selling sub-category.
o Customers overwhelmingly favored Standard shipping, which was chosen tenfold more frequently than the least popular same day shipping option.
o Cash-on-Delivery (COD) dominated payment preferences, followed by online payments and card-based transactions, with this trend consistent across all regions.
o Some incentives can be offered for card users to increase its usage.
o The largest customer segment was consumers followed by corporate and home-office customers. This trend held true across all US regions.

Unusual trend:
o While the profit margin generally exhibited a gradual upward trend, there was a sharp decline in April 2020 followed by a rapid recovery in May 2020. This suggests the presence of promotional activities or similar factors during that period.

Sales Prediction in PowerBi:
o An integrated algorithm was deployed within Power BI.
o However, creating a distinct setup using a Python machine learning algorithm and assessing various algorithms before finalizing the model could offer benefits.