Project Management Dashboard (Snapshot)
Objective: To streamline real estate project management processes and enhance decision-making by utilizing data visualization techniques in Power BI.
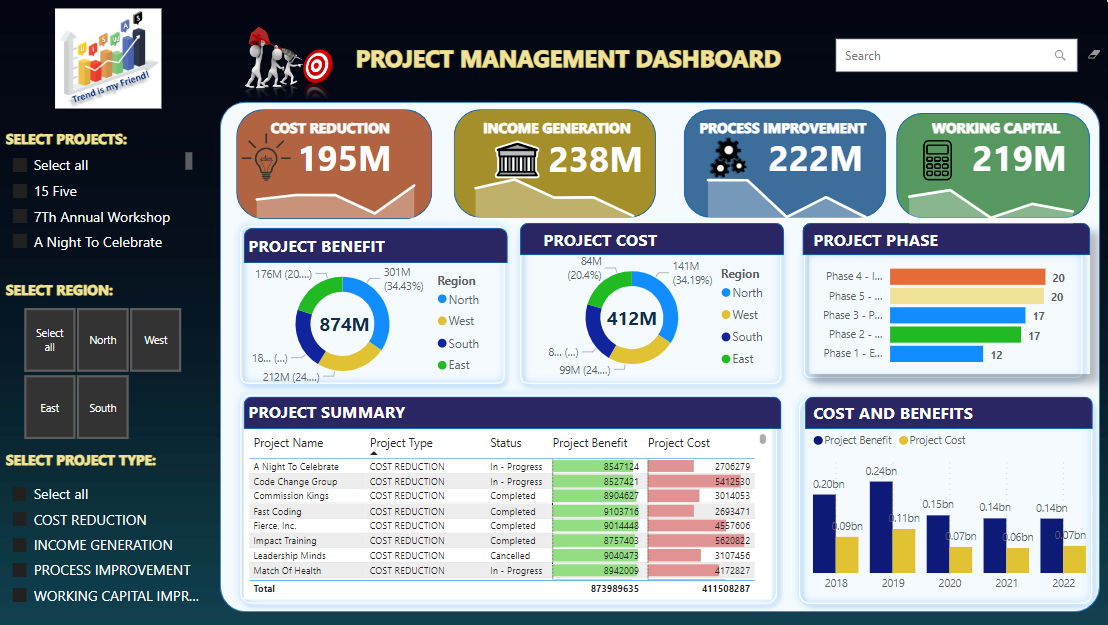
Project Highlights: Visuals Built: (Plesae sign in to your Power BI account to access the interactive embedded dashboard.
I. Developed an interactive dashboard to monitor and manage real estate projects efficiently.
II. Used complex parameters to drill down in worksheet and customization using filters and slicers.
III. Created connections, calculations to manipulate data and enable user driven parameters for visualizations
IV. Incorporated different visualization types to enhance data comprehension
I. Project Overview:
o Project summary in tabular form highlighting Project Name, Project Type and Status of project. It also includes distinct representations of ‘Project Benefits’ and ‘Project Cost’ in coloured bar chart.
II. Project Timeline:
o Color-coded bar chart that displays the count of projects in 5 different phases.
III. Financial Performance:
o Key Performance Indicators (KPIs) for various project categories such as Cost Reduction, Income Generation, Process Improvement, and Working Capital, showcasing financial indicators for finance department.
o Donut charts that display cost and benefits of project across different regions.
IV. Project Type Analysis:
o Slicers (List type) for depicting the different project types within the portfolio.
o Slicers (List type)for selecting particular project.
V. Sales and Benefits:
o Clustered column chart comparing project cost and sales for different years.
VI. Location Insights:
o Slicers (Tiles) showcasing the distribution of projects across different regions.
VII. Search bar
o Search bar for dynamic filtering and intuitive navigation.
The Report contains:
I. Different KPIs
II. Bar Chart
III. Line Chart
IV. Slicers Tiles
V. Doughnut Chart
VI. Tabular (Grid) Chart
If you don't possess an account, the snapshot below provides a decent representation of the Project Management Dashboard.)